Many brands appear to underestimate the search channel on E-commerce platforms because they do not fully understand its role in the customer journey. Nguyen Phuong Lam, Market Analytics Director at YouNet ECI, highlights common mistakes brands make when optimizing search on E-commerce platforms — and how to leverage this channel not only for conversion but also for brand awareness and customer experience.
In YouNet ECI’s E-commerce growth consulting projects, we have observed that most brands join platforms with two main goals: driving sales and enhancing brand presence.
The on-site search channel on Shopee, Lazada, and TikTok Shop plays a vital role in achieving both objectives. However, most brands have yet to fully unlock its potential — resulting in poor customer experience and missed opportunities that competitors quickly capture.
1. The Role of Search in the E-commerce Customer Journey

According to a report by Kantar Profiles, two-thirds of Gen Z consumers consider E-commerce platforms as the starting point of their shopping journey – and also trust these platforms to research products before making a purchase.
Another study conducted by YouNet ECI revealed that during the 11/11/2023 Mega Sale, there were 2.2 million search queries for keywords in the fabric softener category and 1.6 million searches in the infant formula category. Notably, the most searched terms were not product names, but rather informational keywords (e.g., “fabric softener,” “baby milk powder”) and directional keywords (e.g., “facial cleanser for oily skin,” “long-lasting fragrance softener,” “imported baby formula”).
This indicates that, instead of appearing only in the purchase stage as before, the on-site search channel now plays a role throughout the entire journey – from Discovery to Evaluation to Purchase. Customers search category keywords to identify specific needs and feature-related keywords to compare and evaluate brands.
This new trend creates challenges, as many brands’ E-commerce advertising strategies have not yet adapted to these changing consumer behaviors. To help businesses enhance the effectiveness of on-site search investment, YouNet ECI has developed a measurement framework called E-commerce Share of Search Display (eSOSD).
2. Introducing E-commerce Share of Search Display (eSOSD): A True Indicator of Search Visibility on E-commerce Platforms
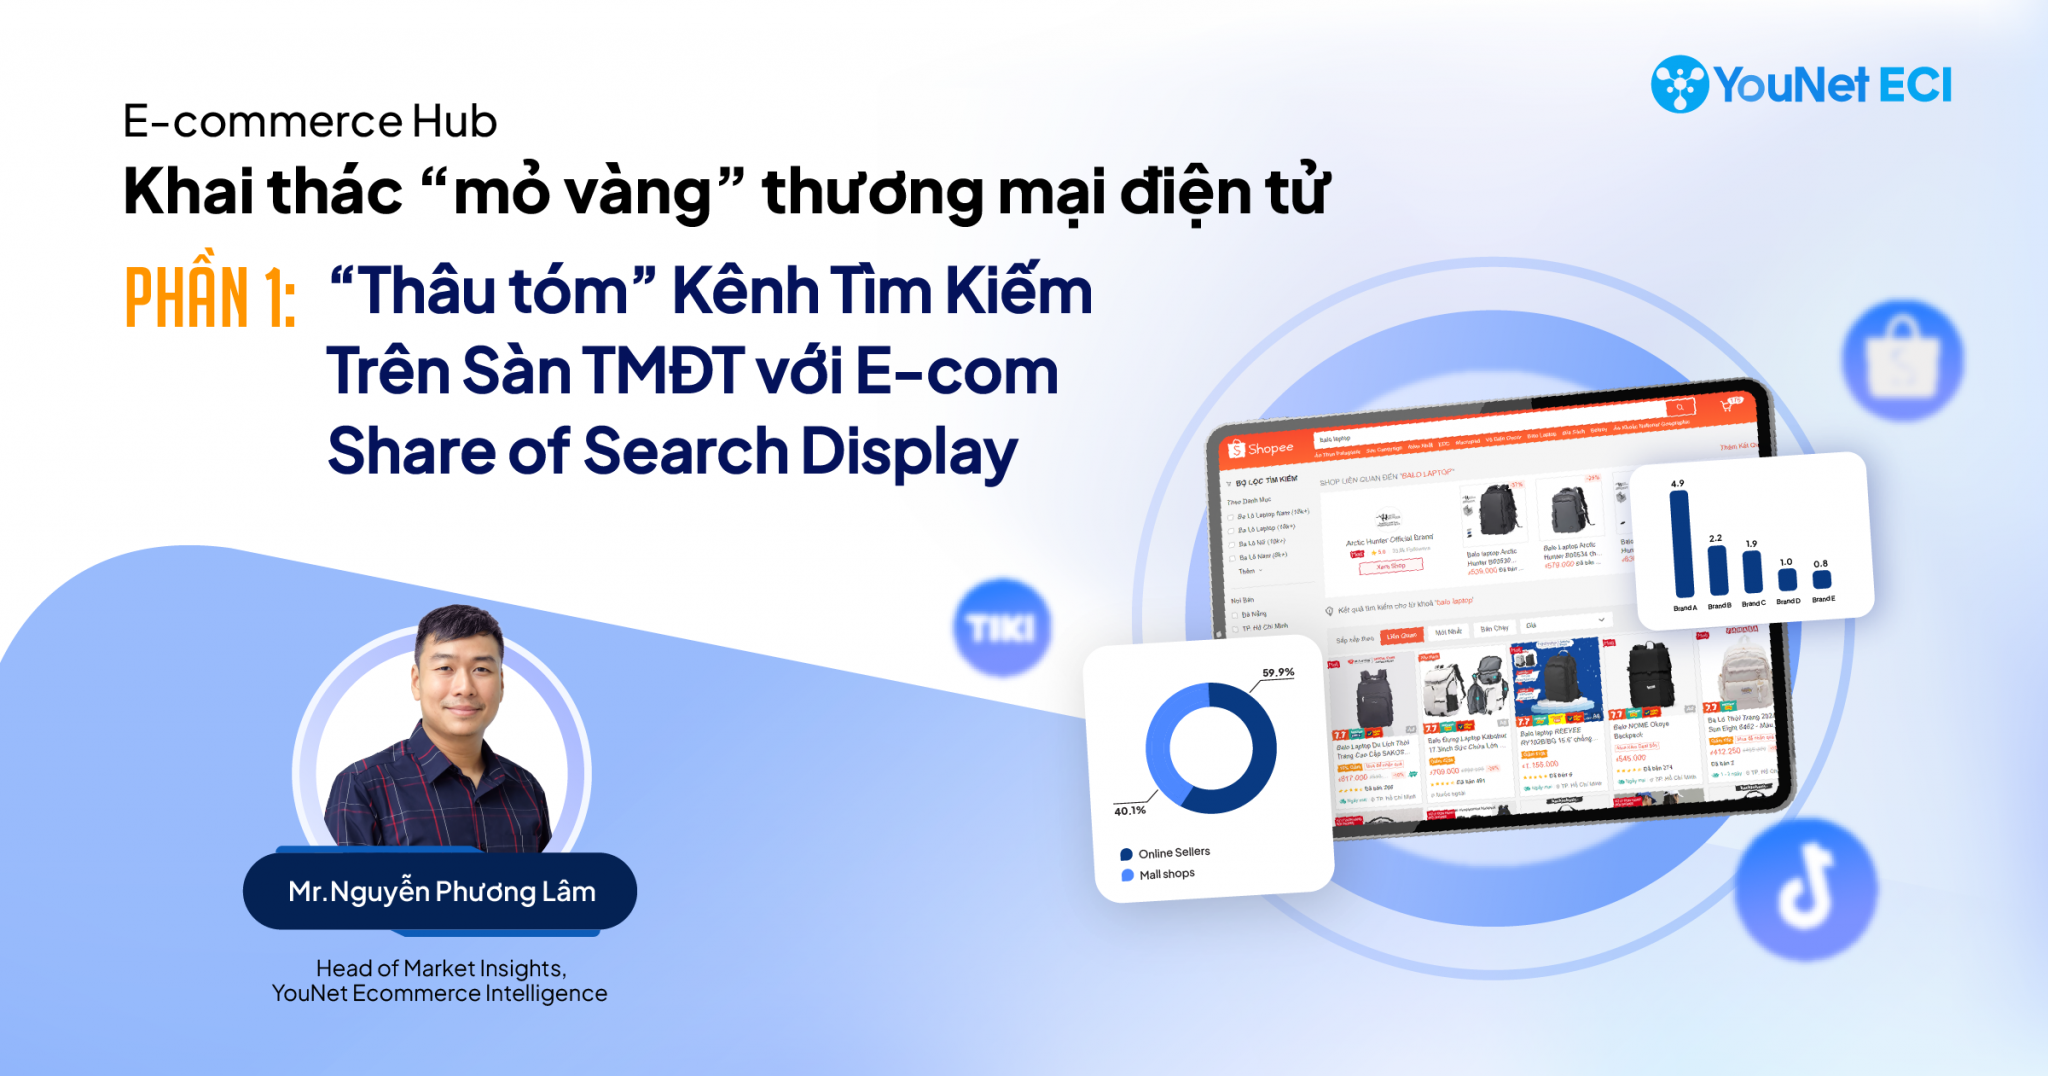
E-commerce Share of Search Display (eSOSD) measures the visibility share of a brand within search results on major E-commerce platforms such as Shopee, Lazada, and TikTok Shop.
The eSOSD index accurately reflects how widely a brand and its product lines appear across key search keywords. More importantly, it benchmarks a brand’s search presence against competitors, highlighting its competitive visibility within the category.
Developed by YouNet ECI, a data-driven E-commerce growth consultancy, eSOSD evolves from the traditional retail metric Share of Shelf, redefined for digital marketplaces.
The formula for calculating a brand’s eSOSD for a specific keyword is:
eSOSD = (Number of product placements of the brand in the first 60 search results for a keyword / 60) * 100%
(The eSOSD for a keyword set is calculated as the average eSOSD of all keywords within that set.)

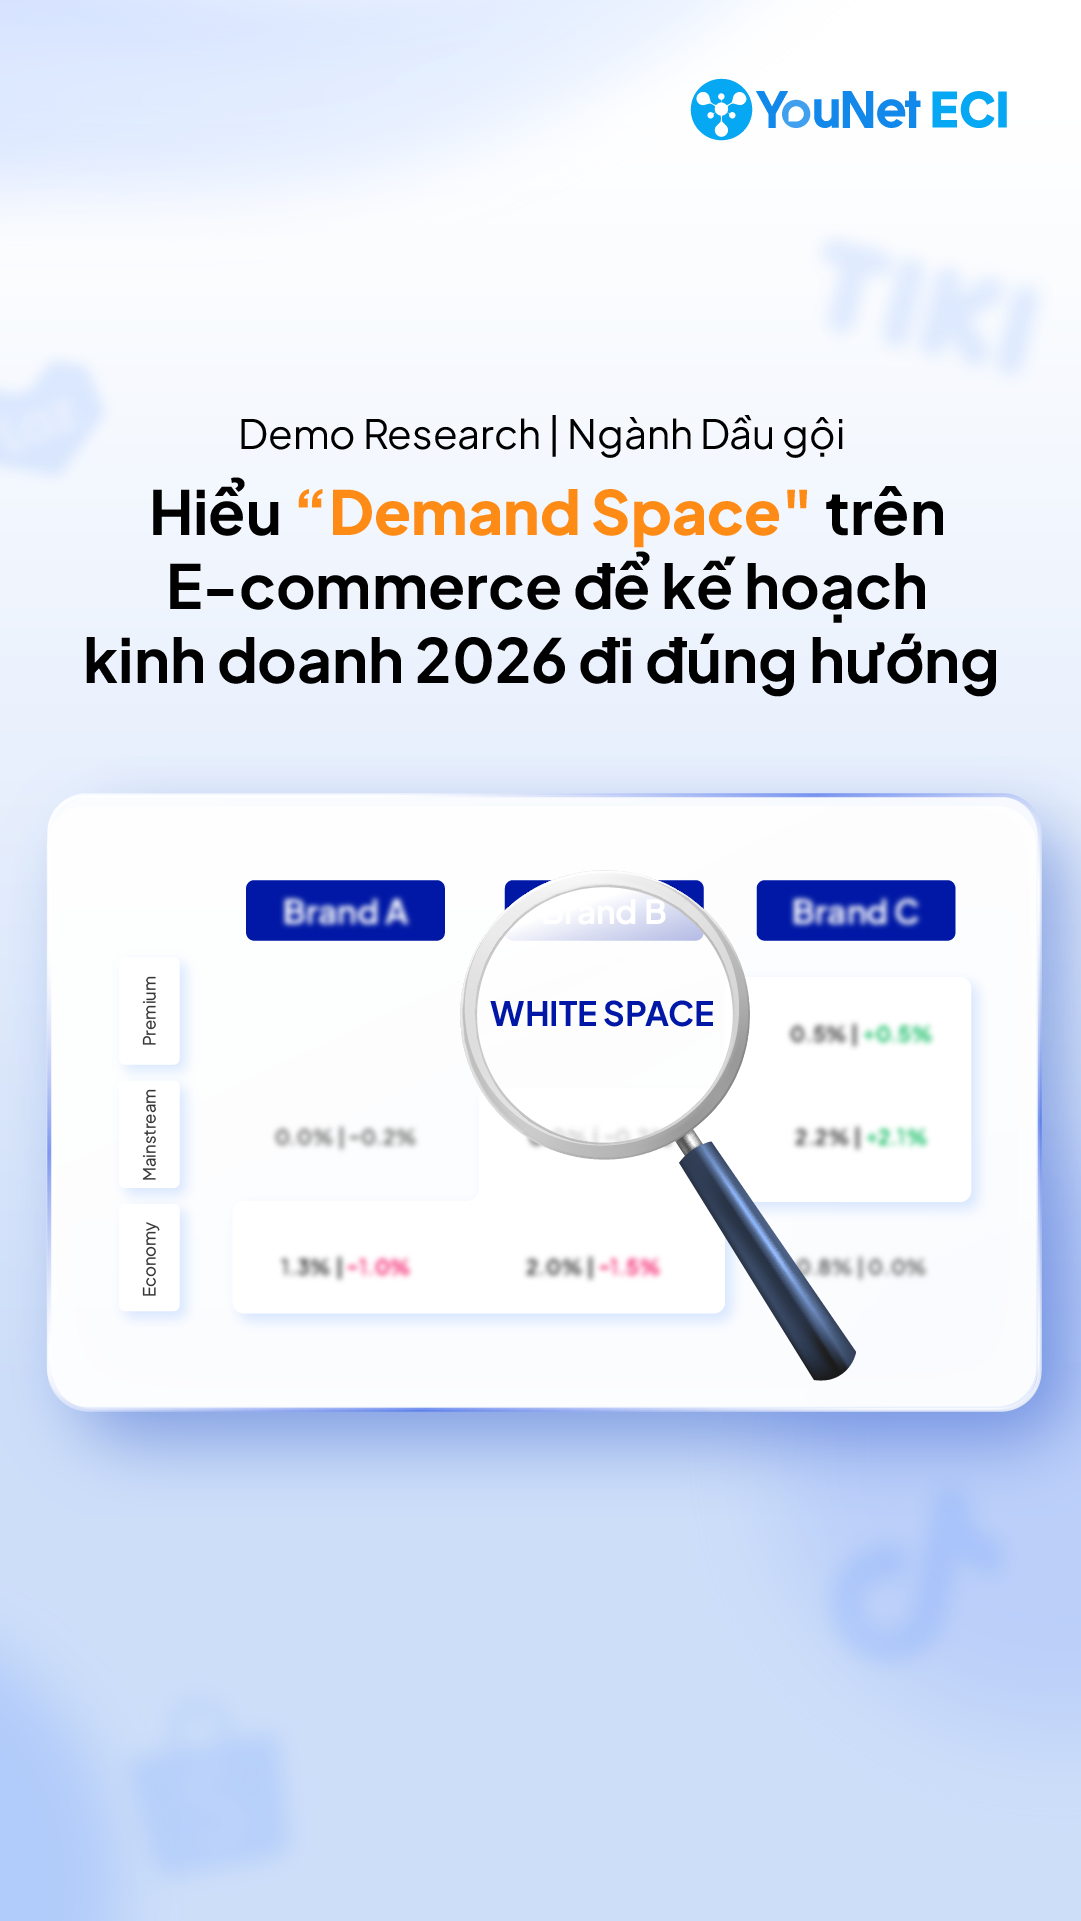
For example, the following eSOSD index table compares two brands in the fabric softener category across a group of fragrance-related keywords.
3. Search Optimization Challenges on E-commerce Platforms That eSOSD Helps Brands Solve:
3.1 When optimizing for conversion goals:
This is the most common and straightforward objective for brands investing in search advertising on E-commerce platforms.
Based on YouNet ECI’s consulting experience, E-commerce and Media teams often focus on the Search Ranking metric (product ranking in search results). While this perspective helps ensure a high ROAS (Return on Ad Spend), it is still incomplete from a brand’s strategic standpoint.
Case study: A brand (Brand A) spends heavily on media campaigns across social networks and traditional advertising channels to educate the market. However, when thousands of customers search for the keyword “fabric softener for babies” on E-commerce platforms, the brand’s products appear only sporadically.
The brand could immediately launch a search ad campaign to push its products to the top position for that keyword. Yet, within the first search results page, there remain 59 other product slots, including around 40 organic positions. Allowing most of these positions to fall into the hands of competitors means the brand is losing significant conversion opportunities.
If the brand relies only on traditional search ad reports, this opportunity cost remains invisible.
By contrast, through the eSOSD index developed by YouNet ECI, the brand can precisely see what percentage of the top 60 search results its products occupy — enabling it to diversify and strategically strengthen its keyword presence to truly “own” its most important search terms.
3.2 When optimizing for visibility goals:
Beyond wasting conversion opportunities, focusing solely on ROAS optimization while ignoring visibility coverage leads to inconsistency in the shopping experience.
Returning to the example of Fabric Softener Brand A — after being convinced of the need for baby-safe fabric softeners, consumers go on E-commerce platforms to search, only to find that 90% of displayed products belong to competitors or unofficial/parallel-import stores.
When customers struggle to locate the genuine product, their trust in the brand’s credibility decreases. At the same time, they risk encountering misleading information or low-quality products from unauthorized sellers.
Thus, even though Brand A has proactively invested in market education, it loses ground right at the beginning of the customer journey on E-commerce platforms.
With YouNet ECI’s eSOSD report, brands can not only track their own visibility performance but also compare it against that of competitors or unauthorized sellers — enabling timely and strategic adjustments.
Next, let’s explore in detail the key analytical objectives included in the eSOSD report.
4. Why Is eSOSD Analysis Important for Brands?
Below is how YouNet ECI conducts search competition analysis and reporting across multiple data dimensions to support each brand’s specific business objectives:
4.1 Market Segmentation Layer
Segmenting based on product characteristics, pricing, origin, etc., depending on the brand’s needs.
Assessing the complexity of consumer search behavior within the category.
Example: Through category and segment-level analysis, YouNet ECI helps brands identify consumer search trends within their specific segment. This enables them to focus optimization on the most relevant keyword groups, avoiding scattered, inefficient investments.

YouNet ECI’s 4-layer eSOSD analytical framework is designed to serve different research and business objectives – from understanding market dynamics to fine-tuning brand positioning on E-commerce search platforms.
4.2 Competitive Brand Layer
Regularly tracks each brand’s search display share compared to competitors within specific keyword groups.
Alerts brands immediately when key keywords are taken over by competitors — especially during peak “Mega Sale” periods.
Identifies new high-search-volume keywords dominated by competitors, helping brands decide where to reallocate investment.
Example: Brand A discovers that the keyword “fabric softener for babies” is being overtaken in eSOSD by a competitor one week before the 11/11 Mega Sale, prompting a timely response through increased keyword investment.
4.3 Product Line Layer
Using proprietary technology developed by YouNet ECI, we automatically classify search results by product line. This enables brands to assess visibility by product line for related keywords, optimizing precisely for strategic SKUs.
Example: Through eSOSD analysis, Beverage Brand B realizes that Product Line C appears in irrelevant keyword searches, while failing to show up sufficiently for keywords aligned with its positioning.
4.4 Storefront Layer
Evaluates the visibility of official brand shops versus unauthorized or third-party sellers.
Flags any loss of eSOSD share on key keywords to small resellers or gray-market stores.
Example: If Brand A’s keyword “baby fabric softener” is dominated by non-official or hand-carried sellers, the brand should consider expanding its official online store presence to reclaim visibility.
With these four analytical layers, eSOSD empowers brands not only to understand their competitive standing but also to strategically adjust operations and marketing to strengthen their visibility and brand equity across E-commerce platforms.
5. How YouNet ECI Measures and Reports eSOSD for Brands:
YouNet ECI is currently the only company in the market that owns technology capable of continuously tracking and processing the eSOSD index, while also applying a proprietary analytical methodology to generate insights and actionable recommendations for brands.
To calculate the eSOSD score, search display data is collected and processed daily from major E-commerce platforms including Shopee, Lazada, and TikTok Shop, following a rigorous 5-step process:
- Step 1: YouNet ECI defines a set of representative keywords for each category based on the brand’s positioning, category characteristics, and keyword search volume.
- Step 2: The EcomHeat platform by YouNet ECI automatically simulates keyword searches on E-commerce platforms, replicating real customer behavior.
- Step 3: All search results are automatically collected daily, then processed using A.I. technology to identify brand names, product lines, and sellers.
- Step 4: The processed data is aggregated and calculated into the eSOSD index, which is then visualized on the EcomHeat dashboard with multiple layers of analysis.

6. Case Study: Tracking and Optimizing eSOSD for an FMCG Brand
A particularly interesting case I encountered while consulting for an FMCG brand involved a company intensifying its investment in E-commerce channels with dual objectives: boosting short-term sales and increasing awareness for a newly launched product line during the year-end shopping season.
By developing a keyword set closely aligned with the brand’s business goals and continuously tracking the eSOSD index across these keywords, YouNet ECI identified several key optimization opportunities for the brand:
- Incorrect Product Display: The product line the brand wanted to promote did not appear for relevant keywords. Instead, older product lines were being displayed. This led to an overall sales increase but failed to achieve the brand’s specific business objective.
- Misaligned Investment Along the Customer Journey: The brand invested heavily in search optimization to secure top search positions. However, compared to competitors in the same category, it lacked a crucial conversion driver—free-shipping incentives during Mega Sale periods.
- Weak Marketplace Distribution: Compared to competitors, the brand relied primarily on its official store while lacking authorized resellers. As a result, its eSOSD was consistently lower than that of competitors who had broader distribution networks and more product listings on E-commerce platforms.
7. Conclusion
In summary, E-commerce Share of Search Display (eSOSD) is an essential metric for brands seeking to enhance visibility in the digital marketplace. By focusing on E-commerce platforms and leveraging advanced tools developed by YouNet ECI, brands can ensure they are seen by the right audience at the right time—driving engagement and sales in an increasingly competitive environment.
About YouNet ECI
YouNet ECI – a member of YouNet Group, is a trusted consultancy specializing in data-driven E-commerce growth solutions for brands.
We provide precise and comprehensive E-commerce market data and analytics solutions with the highest data granularity – empowering brands to understand the full landscape of their categories, monitor brand performance, and optimize product portfolios across online marketplaces.