Data from YouNet ECI shows that traditional promotional campaigns are becoming less effective on e-Commerce platforms. Instead, consumers increasingly prioritize a convenient shopping experience, high-quality service, and strong after-sales policies. In consulting with businesses, YouNet ECI has observed that many companies do not fully grasp the complexity of these requirements. In this article, YouNet ECI will outline the principles and set of metrics the company applies to help businesses achieve healthier business outcomes on e-Commerce.
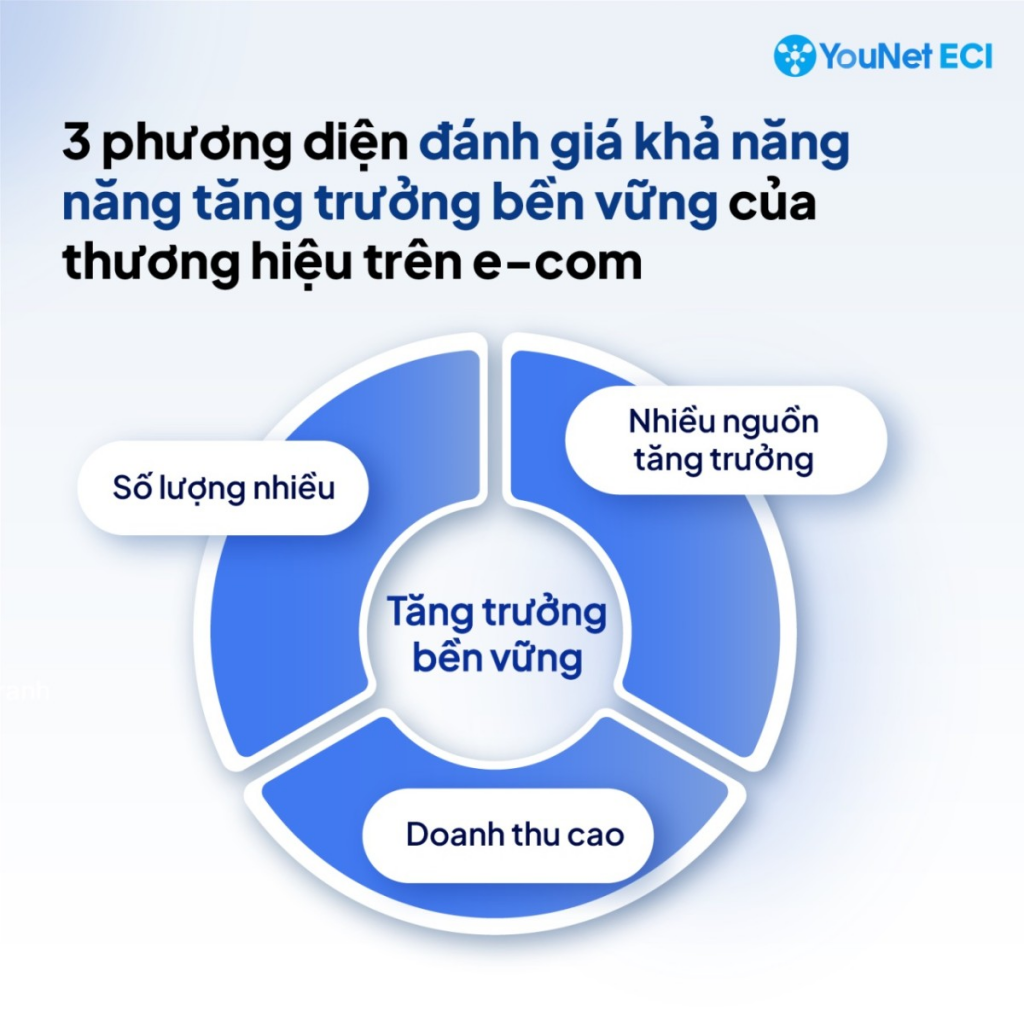
1. “Diversify, Reduce Dependence”: The Key to Sustainable Growth on E-commerce
YouNet ECI, a pioneering company in e-Commerce growth consulting, maintained a highly followed ranking in 2024 called the YouNet ECI Ranking – Ranking the Best-Selling Brands on E-commerce. Over nearly 12 months of implementation, especially after incorporating TikTok Shop revenue data, YouNet ECI observed continuous fluctuations in rankings across different industries.
Newly emerging FMCG brands have overtaken multinational brands, while brands with smaller offline market shares quickly climbed on e-Commerce. At the same time, several strong brands at the beginning of the year lost momentum by year-end due to focusing solely on short-term revenue.
For e-Commerce, short-term revenue performance clearly does not guarantee a brand’s ability to sustain and grow amidst market fluctuations.
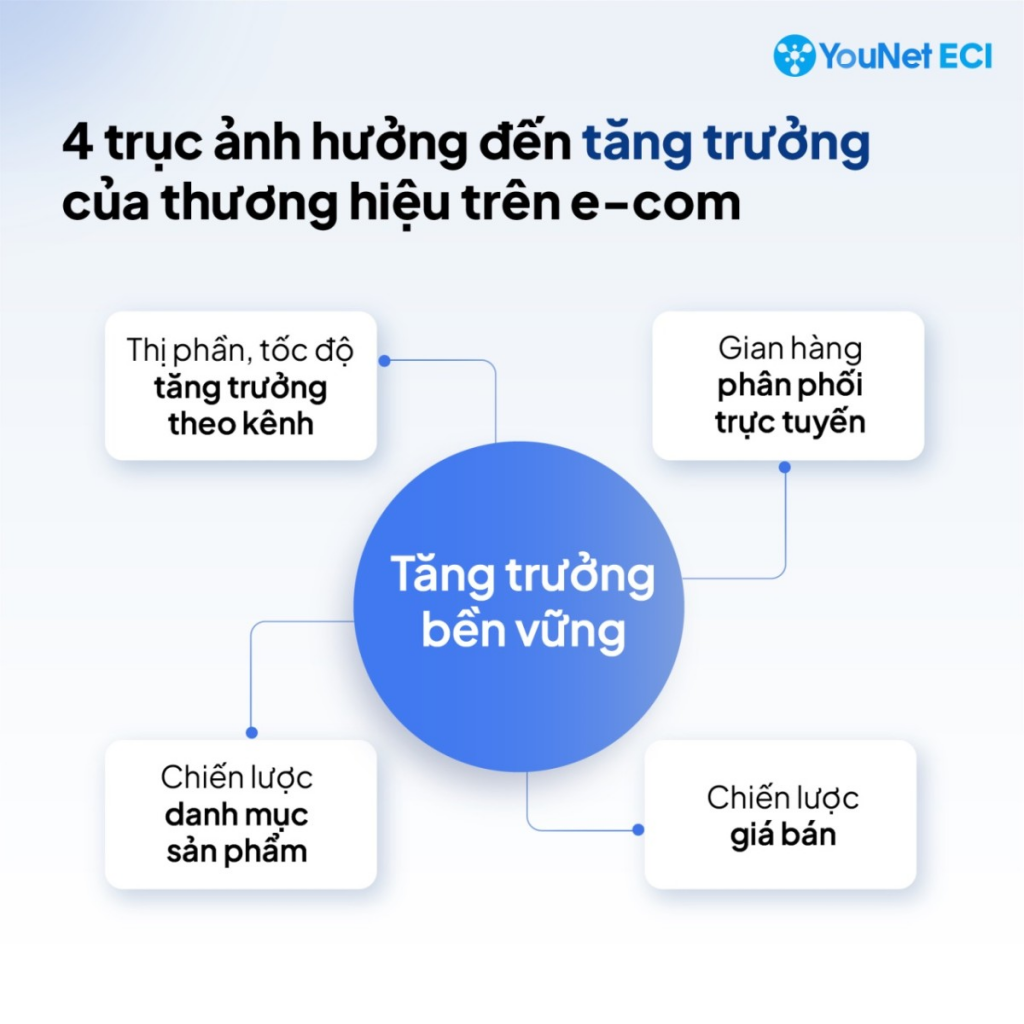
Instead of chasing temporary GMV metrics, YouNet ECI recommends businesses adopt a “diversify, reduce dependence” strategy. This strategy focuses on monitoring and optimizing four core groups of metrics – indispensable pieces for building a foundation for sustainable growth.
2. Performance: Market Share on E-commerce and Revenue Growth Rate
The Performance indicator group forms the backbone of E-commerce operations.
However, YouNet ECI goes beyond measuring and analyzing brand store revenue – it also evaluates the revenue of competitors, retailers, and the entire category to deliver a comprehensive picture through two key metrics:
- Market Share on E-Commerce: Measures the brand’s dominance across e-Commerce platforms. The accuracy of this metric relies on the ability to unify category definitions across different marketplaces.
- Revenue Growth Rate: Determines growth trends by platform, compared with category averages, helping to identify channels with strong development momentum.
The Performance indicator is one of the four key growth elements YouNet ECI provides for brands. The three remaining components below represent insights that only a data-driven growth consulting firm can integrate into its analysis.

3. Distribution Channels: Quantity and Quality of Stores
Distribution channels act as the bridge between businesses and customers, directly influencing sales performance and revenue. An optimal distribution strategy for sustainable growth must consider both quantity and quality, avoiding overreliance on a few key stores:
- Number of Stores: It’s not only about having a large number of stores, but ensuring that multiple stores are capable of generating revenue growth.
- Store Quality: Evaluates the management efficiency, credibility, and operational performance of each store. This helps brands maintain a consistent shopping experience and build customer trust.
4. Product Portfolio: Diversity and Revenue-Generating Capacity
A diverse product portfolio allows businesses to reach different customer segments and minimize risks when one product line faces difficulties. Measuring each product line’s revenue-generating capacity helps identify strategic growth sources.
Revenue-generating capacity is evaluated through indicators such as Variant Quality Index (VQI) and Variant (%) Contribution to Brand Growth, which assess the strength of a brand’s portfolio:
- Variant Quality Index (VQI): Reflects the brand’s presence among the top-performing models – a higher score indicates that the brand’s product portfolio significantly contributes to the category’s overall growth.
- Variant (%) Contribution to Brand Growth: Measures the percentage of models contributing to 80% of total revenue growth, helping identify key models to focus development efforts on.

5. Price Range: Diversity and Performance Across Price Levels
Diversifying and optimizing revenue across multiple price ranges not only enhances a brand’s competitiveness but also reduces the long-term risk of losing market share on e-Commerce platforms. YouNet ECI guides businesses to optimize their pricing strategies through two key indicators:
- Price Range Diversity: Reflects the brand’s flexibility in offering products at various price levels to reach different customer segments.
- Performance by Price Range: Measures the revenue-generating capacity of each price segment, thereby assessing how well the product portfolio is optimized according to the pricing strategy. A key indicator in this group is the Price Range Diversity Index (PRDI), which evaluates the proportion of product lines within the price segments contributing to 80% of the total positive growth in Gross Merchandise Value (GMV).
6. Integrating Insights from YouNet ECI Indicators
The combination of nine sub-indicators across four groups not only reflects sales performance but also reveals the overall operational efficiency on E-commerce platforms. This integration enables businesses to gain deeper insights into their strengths and weaknesses, forming a solid basis for effective strategic improvements.
In March 2025, YouNet ECI officially launched the Sustainable Growth Brand Ranking, honoring the top 50 brands that achieved the highest performance when balancing all nine indicators across the four core groups.
YouNet ECI also provides a dedicated E-commerce performance report for each of the 50 ranked brands, offering detailed insights into every metric.
👉 Register here to receive the complimentary report.
Contact YouNet ECI to learn more and get expert consultation on sustainable growth strategies for your brand on E-commerce.


